In 7 June 2015, there will be an election in Turkey. This is the major event nowadays. Recently a site was created named kararsizkalma, which asks you some questions and returns which political parties you are close to. So after I participated and found out my results, I wondered what was the general behaviour of people who took the same questions.
I wrote a script to parse the public results of other people. Currently I have 320.714 different results and below you can find a simple analysis of them.
Mean values for each party:
- AKP: 10.67
- BBP: 6.12
- CHP: 25.32
- HDP: 21.47
- KP: 8.08
- LDP: 13.63
- MHP: 10.29
- VP: 4.41
AKP has been ruling Turkey for so long and for every election they dominated the elections. That’s why these mean results made me wonder about a couple of things.
- Our sample data, people, are not random but they have some major things in common, biased.
- People are not biased but the questions themselves are biased, none knows the algorithm behind except the builders of the site.
In either case, lets keep analyzing.
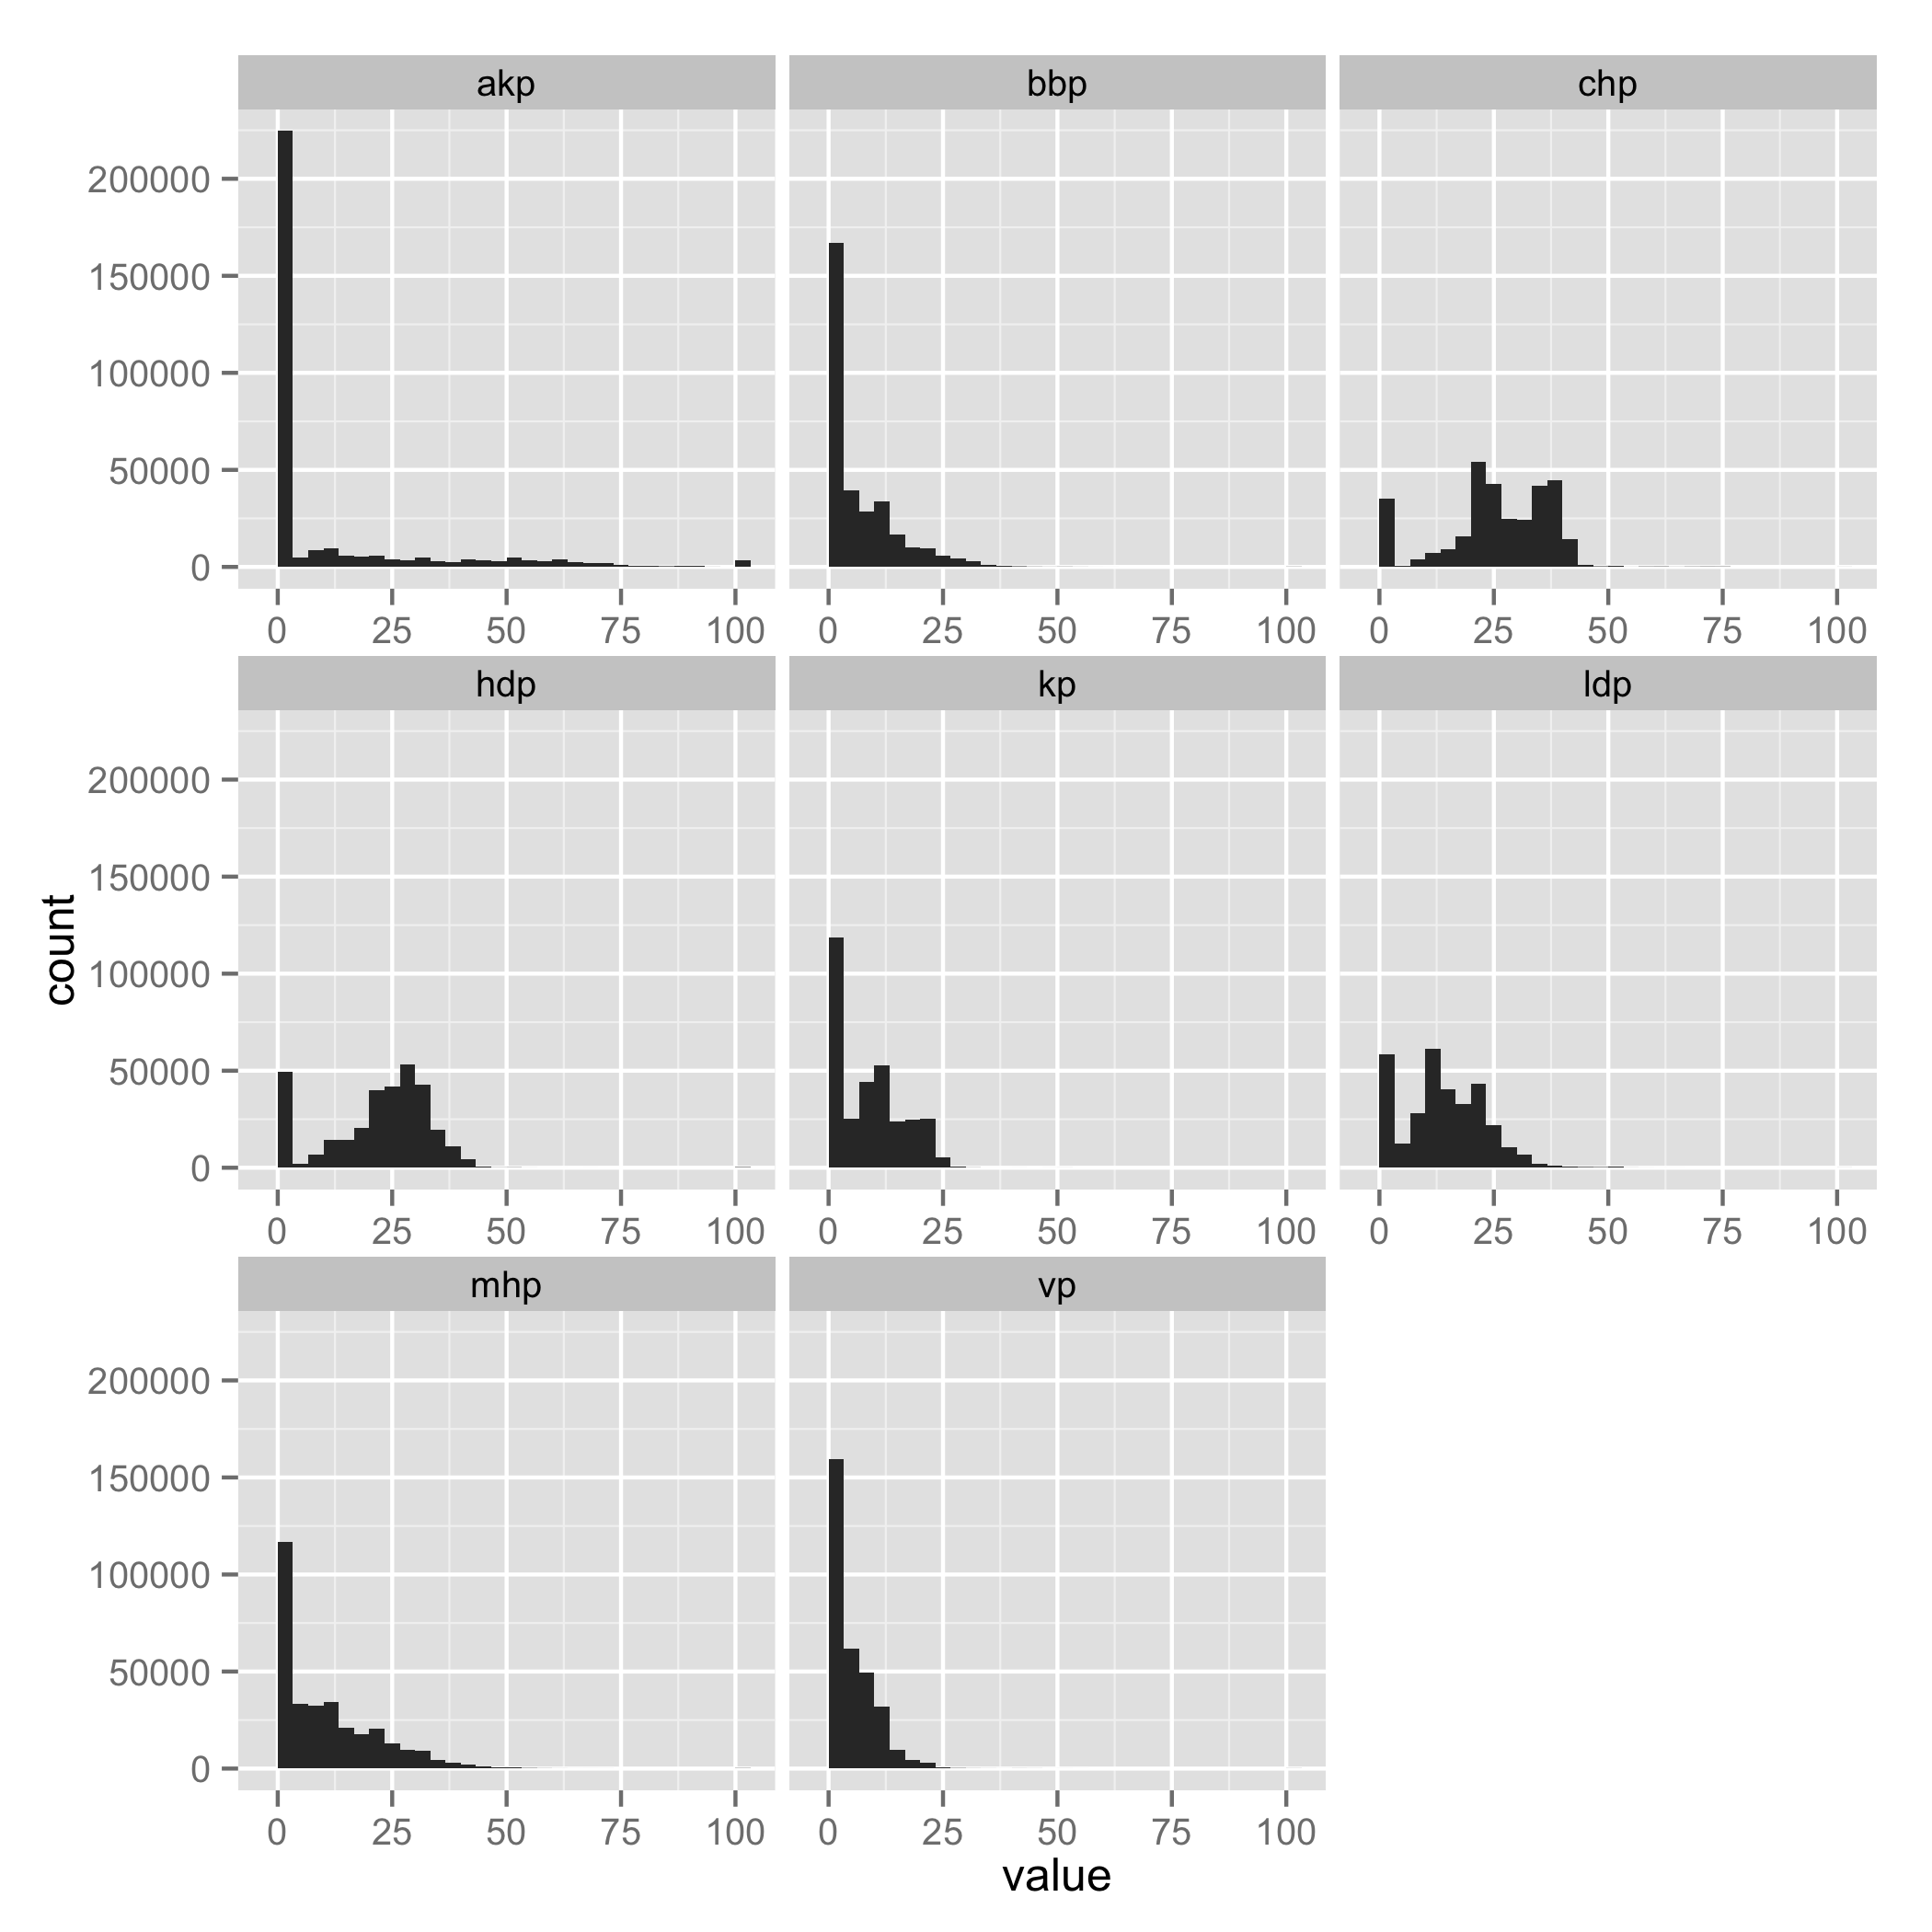
I wanted to see the distribution of the data, so lets have a look at histograms of each party.
Now I wanted to analyze correlations between parties. I know which parties are closer to each other in terms of views of their supporters but I wanted to see if dataset would reflect real life results.
Below you can see correlation plot of parties clustered hierarchically.
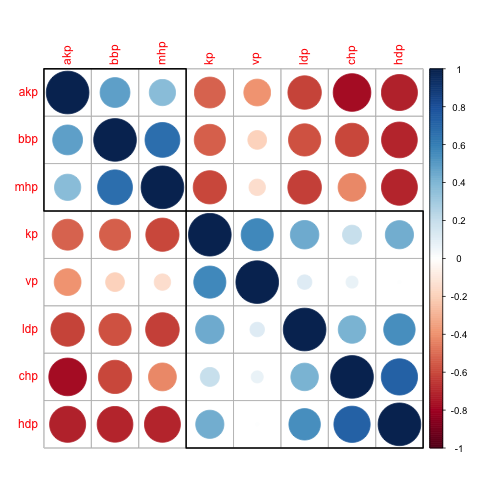
The size of the circle is bigger if the absolute value of the correlation is bigger and the color is more blue if the correlation is higher and more red if correlation is lower. By looking into the plot, one can see the relation between CHP-HDP and BBP-MHP.
Lets look into their correlation values.
- CHP-HDP: 0.7224982
- MHP-BBP: 0.667174
This verifies our plot and also this is a one to one matching of real life case.
Even though our dataset is some how biased, relations are still here.
Ps: This post will be updated when more analyses are done.